
The United States may have managed to keep the COVID-19 pandemic from becoming a major killer.
The virus that causes COVID-19 pneumonia and heart inflammation, severe acute respiratory syndrome coronavirus 2 (SARS-CoV-2), has infected about 644,000 people in the United States and killed about 29,000.
Public health officials worry the pandemic may just be starting to move into some communities.
But the National Center for Health Statistics, an arm of the U.S. Centers for Disease Control and Prevention, has released a weekly COVID-19 activity report with maps suggesting that the United States might be getting the pandemic under control, and that the country still has a chance to hold overall mortality within relatively normal levels.
Resources
- The CDC’s weekly flu report is available here.
- The CDC’s weekly COVID-19 report is available here.
- The CDC’s provisional COVID-19 mortality data table is available here.
The CDC bases some of its COVID-19 tracking charts and maps on data on confirmed cases of people with COVID-19.
The CDC bases other charts and maps on data on all kinds of cases of pneumonia and “influenza-like illnesses.”
Even if states had trouble keeping track of COVID-19 cases, a severe COVID-19 outbreak would lead to increases the number of people going to doctor for influenza-like illnesses, or dying from “pneumonia and influenza.”
A severe COVID-19 outbreak that killed people without causing pneumonia would show up in the CDC’s “deaths from all causes” data.
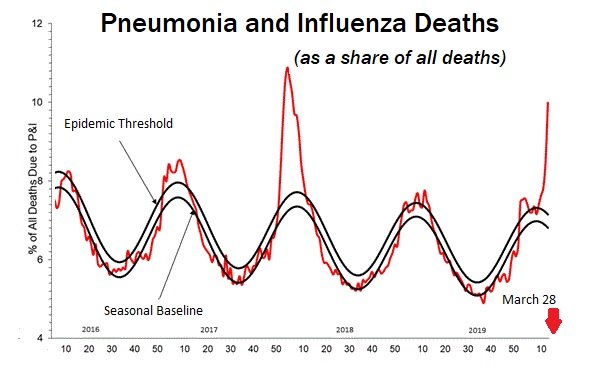
Deaths
The new weekly COVID-19 report shows that the percentage of all U.S. deaths caused by pneumonia and influenza spiked to epidemic levels in the week ending March 28 — the last week in the pneumonia and influenza chart.
But, even at the end of March, the percentage of all deaths recorded as being caused by pneumonia or influenza was still below the level recorded in late 2017.
A set of tables linked to that chart shows that states first began reporting a significant number of deaths caused by COVID-19 during the week ending March 21. The percentage of all deaths classified as being caused by COVID-19 increased to 11 percent during the week ending April 11, from 1percent during the week ending March 21.
The death count totals for the weeks ending April 4 and April 11 are still incomplete. The CDC death count tables for earlier weeks show that, from the week ending Feb. 1 through the week ending March 28, the average number of deaths was about 6 percent below the three-year average.
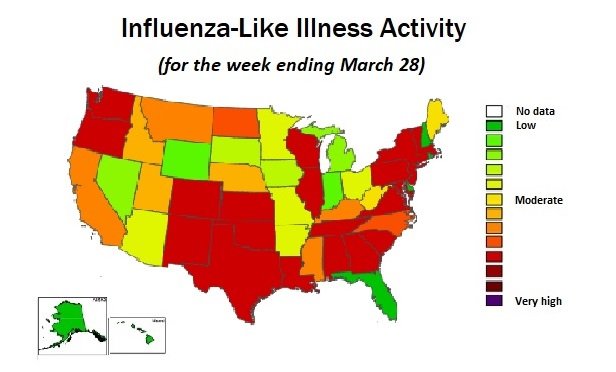
The influenza-like illness activity maps
The weekly COVID-19 report also includes two maps, for influenza-like illness activity, that suggest that efforts to close schools and get people to stay home might be slashing the overall level influenza-like illness activity.
The map for the week ending March 28 shows high or very high influenza-like illness activity in most of the country.
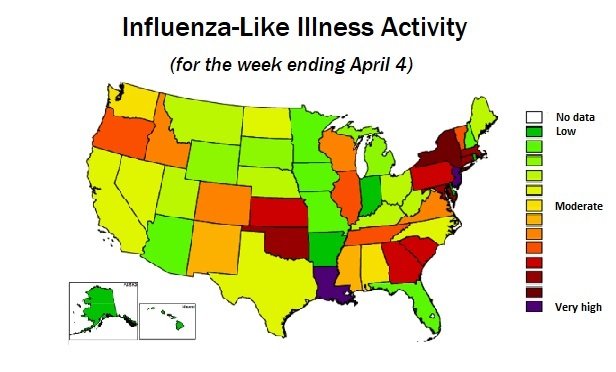
The map for the week ending April 4, after many states had imposed strict “shelter in place” rules, shows that the activity level in most states fell to a moderate level or lower.
The states that reported very high influenza-like illness activity levels for the week ending April 4 are Georgia, Kansas, Louisiana, Maryland, Massachusetts, New Jersey, New York, Oklahoma, Rhode Island, and South Carolina.
Office visits
The weekly COVID-19 report also includes a chart show trends in outpatient office visits for influenza-like illness as a percentage of all office visits.
The typical level is 2 percent.
The level for the week ending April 4 was 3.9 percent, but that’s down from a recent peak of about 6.4 percent during the week ending March 21.
CDC weekly COVID-19 death counts
Week ending date |
COVID-19 Deaths |
Deaths from All Causes |
Percent of Expected Deaths |
| Feb. 1 | 0 | 56,557 | 95 |
| Feb. 8 | 0 | 57,067 | 96 |
| Feb. 15 | 0 | 56,079 | 95 |
| Feb. 22 | 0 | 55,605 | 96 |
| Feb. 29 | 5 | 54,900 | 96 |
| March 7 | 19 | 54,222 | 94 |
| March 14 | 44 | 52,187 | 91 |
| March 21 | 447 | 51,428 | 91 |
| March 28 | 2,205 | 51,602 | 92 |
| April 4* | 4,462 | 46,917 | 84 |
| April 11* | 2,499 | 22,012 | 40 |
| * Reporting for these weeks is still incomplete. | |||
| Source: U.S. Centers for Disease Control and Prevention, National Center for Health Statistics, Provisional Death Counts for Coronavirus Disease (COVID-19). | |||
Read more:
- Historic flu season drives health-care industry sales
- U.S. men tend to brush off COVID-19 health warnings even as death toll rises
- Alcohol-related deaths are on the rise
NOT FOR REPRINT
© 2024 ALM Global, LLC, All Rights Reserved. Request academic re-use from www.copyright.com. All other uses, submit a request to [email protected]. For more information visit Asset & Logo Licensing.
NOT FOR REPRINT
© 2024 ALM Global, LLC, All Rights Reserved. Request academic re-use from www.copyright.com. All other uses, submit a request to [email protected]. For more information visit Asset & Logo Licensing.