Midlevel associates put their noses to the grindstone in 2010, and they didn’t like it. While demand for legal services rose, staffing at the biggest firms still lagged behind prerecession levels. As a result, third-, fourth-, and fifth-year associates had their most demanding year since the downturn began, averaging 2,037 billable hours in 2010, compared to 1,957 in 2009. Adding the equivalent of two extra weeks of work may not sound like much, but it marked the highest number of associate billable hours since 2007. That probably helps explain why our survey of 5,361 midlevel associates from 149 law firms showed the average firm composite score declining for the second straight year to the lowest associate satisfaction score since 2004. As one DLA Piper associate told us: “Firms got too lean [after the recession] and consequently realized that associates will work more and more if asked. Quality of life has therefore decreased.”


Previous Associates Survey coverage :: 2010 | 2009 | 2008 | 2007

THE FEATURES

UNDER PRESSURE Welcome to the postrecession world. Demand for legal services is up—associates billed an extra 80 hours last year—but hiring is slow. One small consolation: Salaries are at their highest level in five years. Phew!
MOVING ON UP Foley Hoag moved up 92 places— from 115th last year to twenty-third this year—on our annual associates survey.
A WASTE OF MONEY? More than 40 firms doled out spring bonuses this year, but there’s no indication that the money will help retain associates.
SUFFERING IN SILENCE Columnist Steven J. Harper notes that as unhappy as the respondents to our midlevel survey sound, their plight could be worse. Just ask some of their fellow law school graduates.
IN THEIR OWN WORDS Answers to our open-ended questions capture the midlevel mood in key categories.

INTERACTIVE GRAPHIC:
CITY-BY-CITY SURVEY DATA


THE CHARTS

RANKING MIDLEVEL SATISFACTION A national ranking of how third-, fourth-, and fifth-year associates rate their firms as workplaces. Drill down for firm-level data on how firms scored in such areas of quality of work, firm culture, and training.
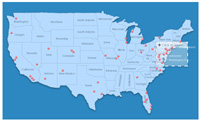
THE LOCAL PICTURE Explore this interactive map to discover how firms fared on a market-by-market basis.
LEVELING THE PLAYING FIELD A comparison of firms according to size.
BY THE NUMBERS: HOW MIDLEVELS SEE THEIR CAREERS AND THEIR PROSPECTS Download a mini-poster of midlevels’ views on pay, workload, retention, and the future.
METHODOLOGY A note on how we tabulate the scores and rankings for our annual survey.